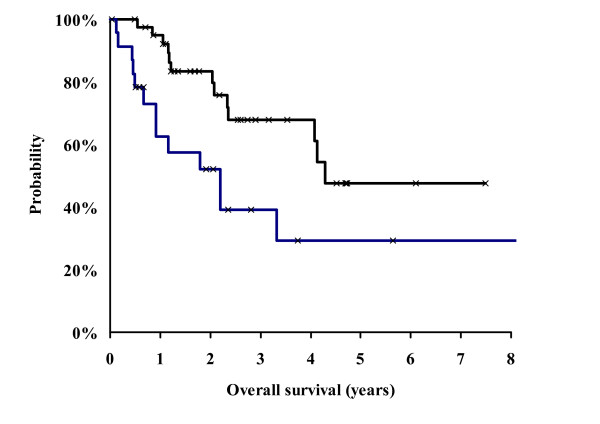
Figure 2.

Kaplan Meier Analysis of survival probability. Comparison between patients who completed the SCHARC-scheme (n = 40, black line) and patients with modified therapy (n = 24, blue line). The Cox regression analysis showed a statistically significant difference between the groups (p = 0.01).
