
Figure 1.
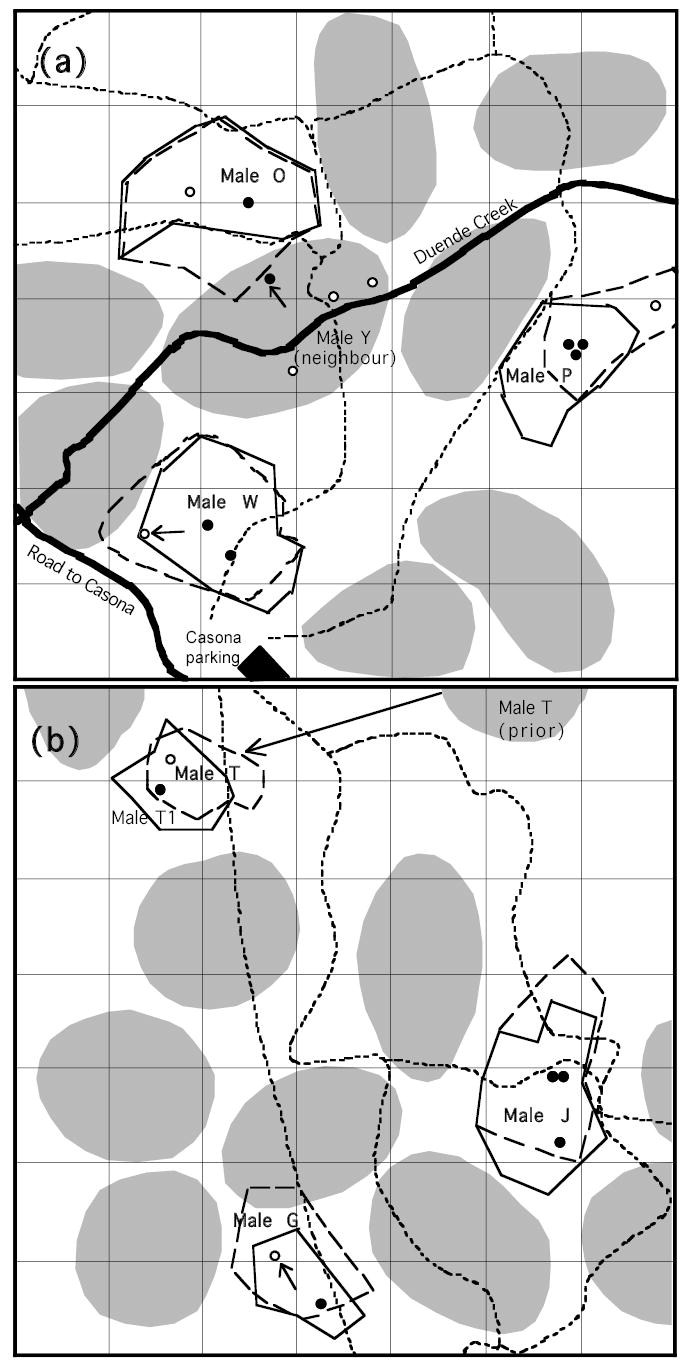
Maps of study areas showing first and last days’ territory boundaries and sequential nest site locations for the six focal males in the Santa Rosa population (a) and the Cerco de Piedra population (b). The solid black outlines shows the initial territory area determined from focal bird activity on the first day of observation, and black dots show nest locations in the same period. The dashed outlines and white dots show the territory boundaries and nest locations toward the end of the season. The approximate locations of neighbour territories are shown in grey ovals. The four nest sites for Male O’s neighbour Y are also shown in colors associated with male O’s boundary positions; male Y’s boundary nest caused the boundary shift between these two males. Arrows indicate the nests that caused boundary shifts and the direction of the shift. Male T1 occupied Male T’s territory on the first recording day. Each square is 50 m on a side. Trails are drawn with thin dashed lines, and streams, roads and buildings are also indicated.