
Figure 4.
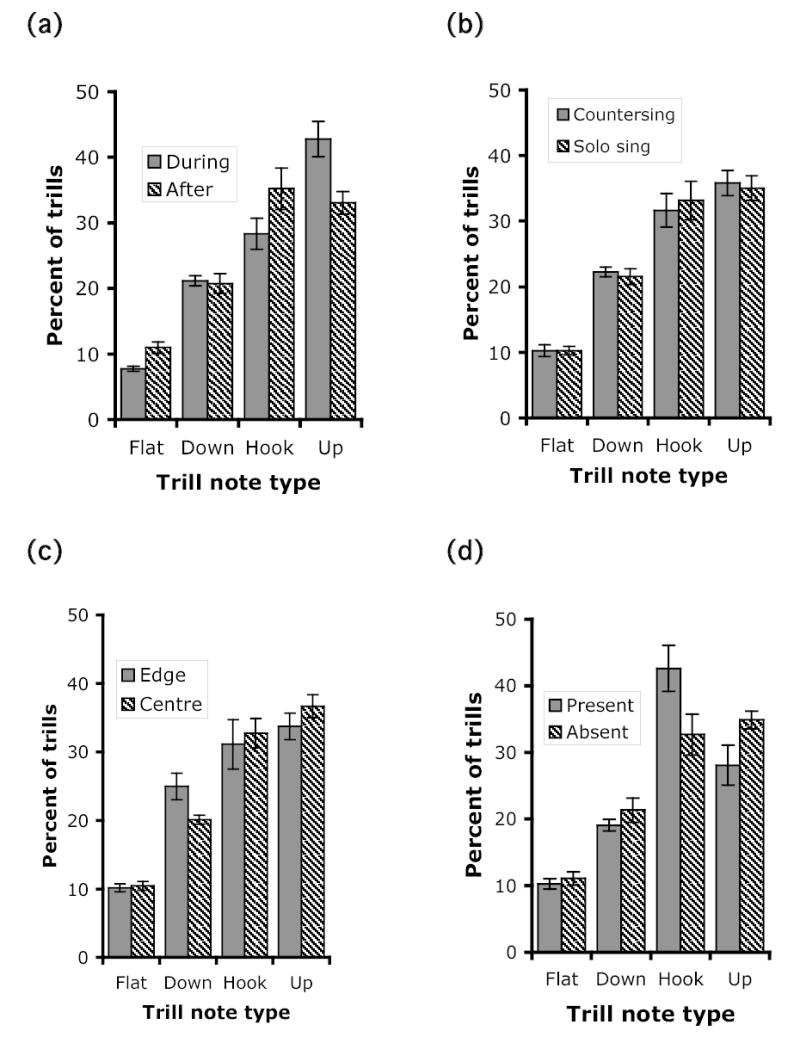
Main effects of each of the four contexts on the percentage of flat-, down-, hook- and up-note trills delivered. Bars show the mean ± SE of the percent of songs of each trill type for the six focal males. a) during versus after dawn chorus, b) countersinging versus solo singing, c) singing from the territory edge versus centre, and d) female present versus absent (after dawn chorus). Results of nominal logistic regression analysis of trill type presented in Table 5.