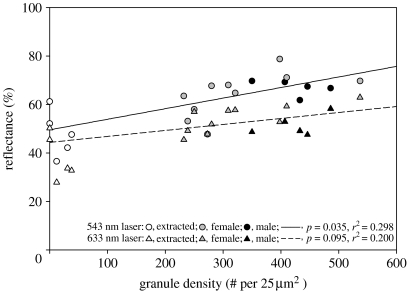
Figure 4.
Plot of granule array density versus scale reflectance. Measurements for both variables were conducted on the same regions of the same scales. Regression lines indicate a positive correlation between granule array density and scale reflectance within the natural range of variation, which is significant for measurements using the 543 nm laser and consistent, but not significant, for measurements at 633 nm. Values from extracted scales are added for illustration, but were not included in regression calculations. However, note the close correspondence between actual values from extracted scales (scales with artificially lowered granule densities) and predicted values from regression equations derived solely from unextracted scale values. Also, note that most values for intact female scales fall below those for males, presenting a possible mechanism for the sexual dichromatism found in this species (see figure 2).

