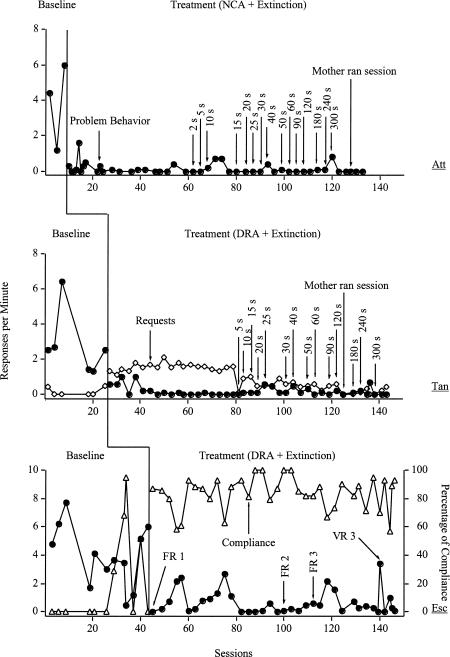
Figure 1. Results of the treatment analysis for the attention condition (top), tangible condition (middle), and escape condition (bottom).
Responses per minute of problem behavior are shown on the y axis on all panels, and the percentage of compliance is shown on the secondary y axis for the escape condition.

