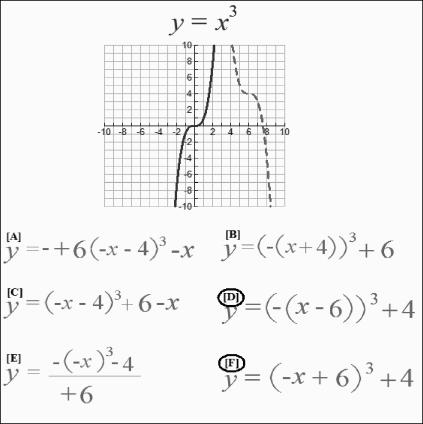
Figure 4. One of the 30 tests of novel graph-to-formula relations.
The solid line represents the basic exponential function (y = x3), and the dashed line indicates the transformation when the formula becomes more complex. A participant who identified that this function included a negative coefficient of x, a positive constant 6 within the argument, and a positive constant 4 following the argument would select F as the correct comparison item in its standard form or D as the correct comparison item in its factored form.

