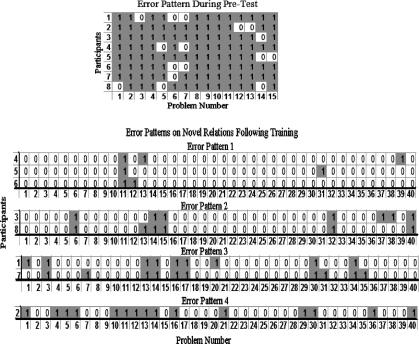
Figure 7. The top block shows the correct and incorrect responses on the pretest.
Problem numbers are listed along the x axis for each of the 8 participants. Accurate responses contain the digit 0; errors are shaded blocks containing 1. The four blocks beneath show the same participants' error patterns following training and classification by error patterns.

