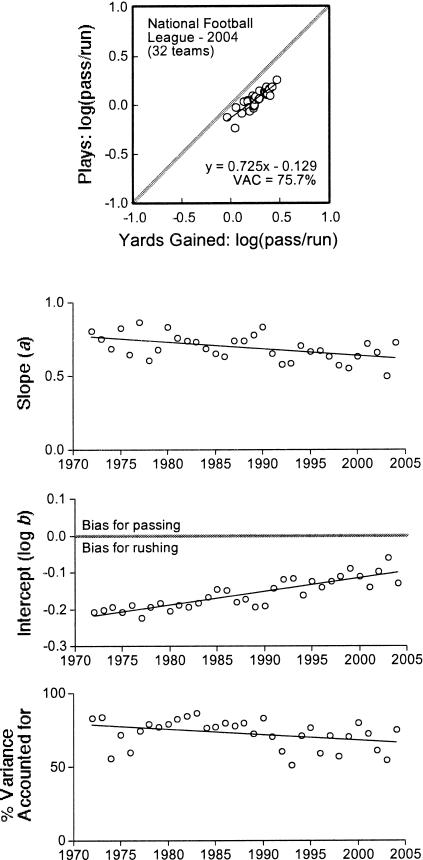
Figure 2. Top: results of applying the generalized matching law (Equation 1) to 2004 regular-season play calling by NFL teams.
Each data point represents one team. Heavy diagonal lines indicate perfect matching. Bottom three panels: slope, intercept, and variance accounted for by Equation 1 when applied to the 1972 through 2004 NFL regular-season data. Trend lines were determined using least squares linear regression. See text for further explanation.

