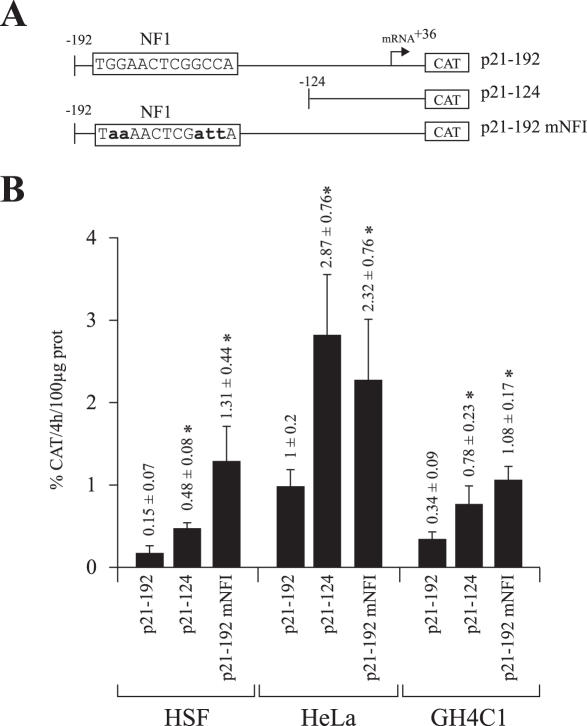
Figure 4.
Transient transfection analysis. (A) Schematic representation of the plasmids used. The NFI target site from the p21 promoter is shown. Numbers indicate positions relative to the p21 mRNA start site. (B) The plasmids shown in A were transfected into HSFs, as well as in the tissue culture cell lines GH4C1 and HeLa. Cells were harvested and CAT activities determined and normalized to secreted hGH. *CAT activities that are statistically different from those obtained with the p21–192 construct (P < 0.05; paired samples, t-test).

