
Fig. 1.
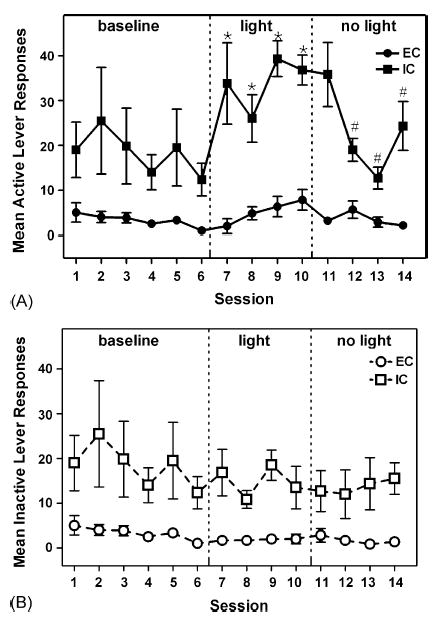
Number of active (A) and inactive (B) lever responses for EC and IC rats during the six baseline sessions (left panels), four light sessions (middle panels), and four no light sessions (right panels) in Experiment 1. Data are expressed as mean ± S.E.M. lever presses for each session. Asterisk (*) denotes significant within-subject difference compared to Session 6 and number sign (#) denotes significant within-subject difference compared to Session 10, p < .05. Note that baseline responses plotted for Sessions 1–6 (left panels) represent the average on the right or left lever alone, since neither lever was designated as active or inactive during this initial phase of the experiment.