
Fig. 2.
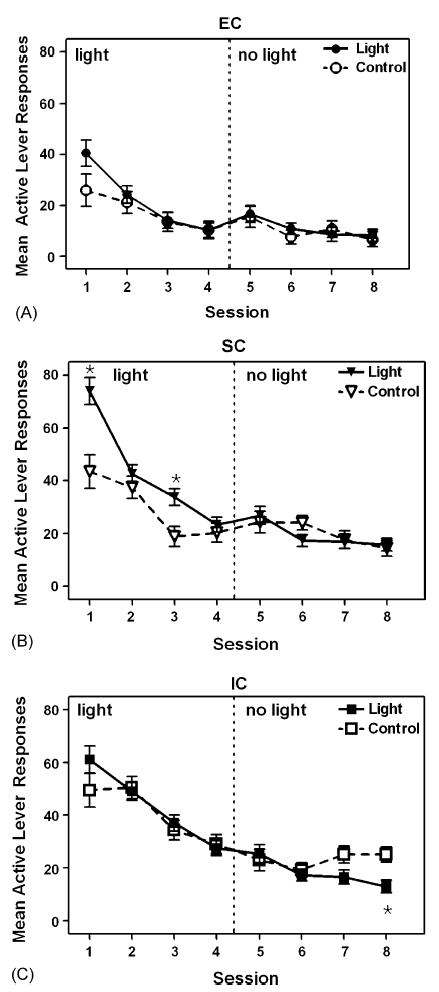
Number of active lever responses for EC (A), SC (B), and IC (C) rats in the Light and Control groups in Experiment 2. In the light phase (Sessions 1–4), the Light group received contingent light; in the no light phase (Sessions 5–8), neither group received contingent light. Data are expressed as mean ± S.E.M. lever presses for each session. Asterisk (*) denotes significant difference (p < .01) from the Control group.