
Fig. 4.
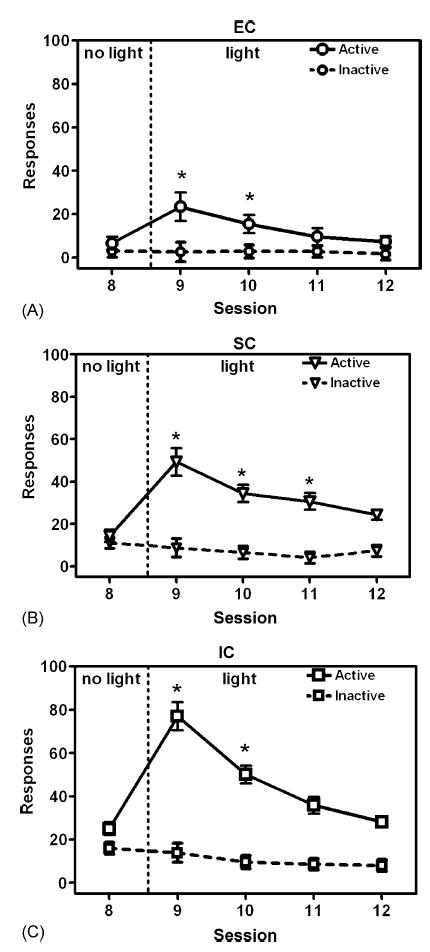
Number of active and inactive lever responses for EC (A), SC (B), and IC (C) rats in the Control group during the last session with no light (Session 8) and the four sessions with light (Sessions 9–12) in Experiment 2. Data are expressed as mean ± S.E.M. lever presses for each session. Asterisk (*) denotes a significant within-subject difference (p < .05) compared to Session 8.