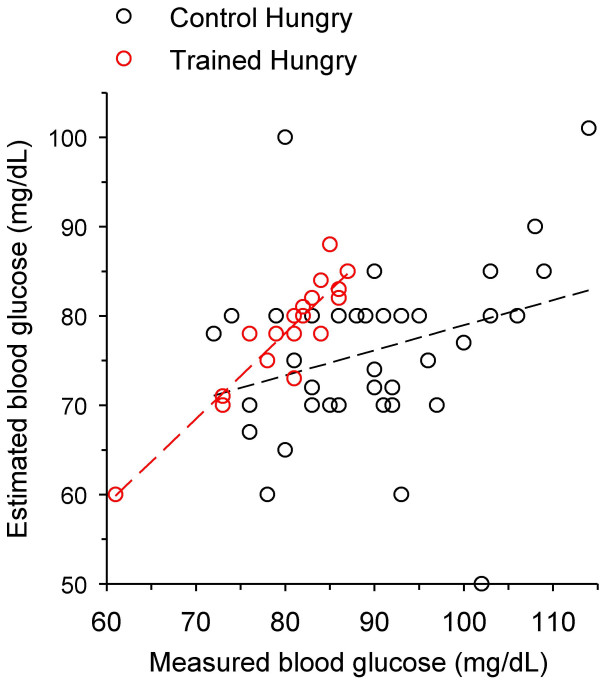
Figure 3.
Estimated vs measured blood glucose of subjects reporting to be hungry at the final laboratory investigative session. Hollow red circles, trained hungry subjects (n = 18); hollow black circles, control (untrained) hungry subjects (n = 42). Linear correlation was significant for the trained data (dashed red line; r = 0.92; p = 0.0001) but not for the control data (dashed black line; r = 0.29, p = 0.06).

