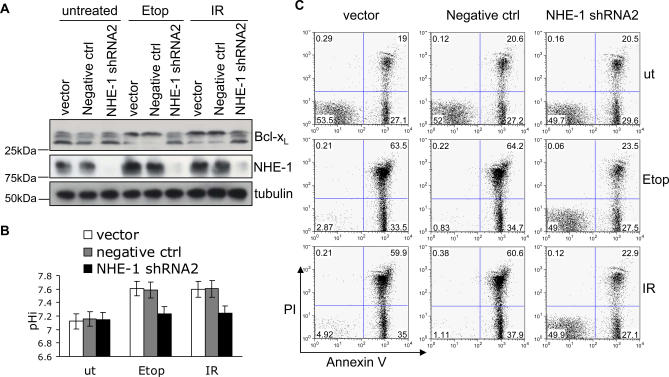
Figure 5. NHE-1 Knockdown Blocks DNA Damage–Induced Bcl-xL Deamidation and Apoptosis.
(A) Empty vector, negative control, or NHE-1shRNA2 were transduced into wild-type thymocytes, then treated with Etoposide (Etop) or irradiation (IR) prior to immunoblotting for NHE-1 and Bcl-xL.
(B) Aliquots of the cells from (A) were analysed for pHi. The histogram represents mean values ± SD (n = 3).
(C) Aliquots of the cells from (A) were analysed for apoptosis by Annexin V/PI staining using flow cytometry, as illustrated in a representative experiment (total n = 5). The numbers shown are the percentage of cells in each quandrant. Histograms summarising the percentage of apoptotic cells (Annexin V+PI−) and dead cells (Annexin V+PI+) are shown in Figure 6B.

