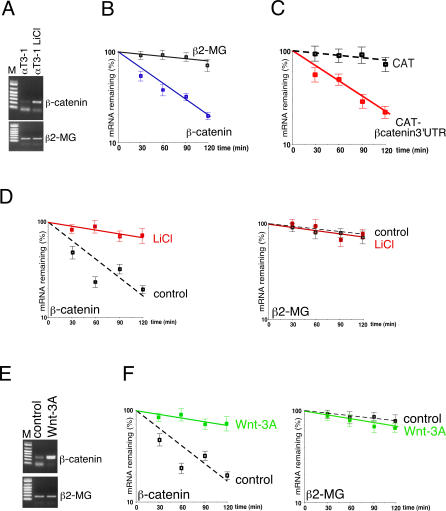
Figure 1. mRNA Encoding β-Catenin Is Labile and Is Stabilized by LiCl and Wnt-3A.
(A) Expression of β-catenin and β2-MG (control transcript), monitored by RT-PCR, in control and in LiCl-treated (20 mM for 6 h) αT3-1 cells.
(B) Quantitative RT-PCR analysis of both β-catenin and β2-MG transcripts in αT3-1 cells. Total RNA was isolated at the indicated times after addition of actinomycin D. The values shown are averages (±SEM) of three independent experiments performed in duplicate.
(C) Quantitative RT-PCR analysis of both CAT and CAT–β-catenin transcripts in either CAT or CAT–β-catenin transiently transfected αT3-1 cells. Total RNA was isolated at the indicated times after addition of actinomycin D. The values shown are averages (±SEM) of three independent experiments performed in duplicate.
(D) Semiquantitative RT-PCR analysis of both β-catenin and β2-MG transcripts in either control or LiCl-treated αT3-1 cells. Total RNA was isolated at the indicated times after the addition of actinomycin D. The amount of each transcript was quantitated by densitometry and plotted using a linear regression program. The values shown are averages (±SEM) of three independent experiments performed in duplicate.
(E) Expression of β-catenin and β2-MG, monitored by RT-PCR, in either control-treated αT3-1, or Wnt-3A–treated (10 ng/ml, 6 h) αT3-1 cells.
(F) Semiquantitative RT-PCR analysis of both β-catenin and β2-MG transcripts in either control or Wnt-3A–treated αT3-1 cells. Total RNA was isolated at the indicated times after the addition of actinomycin D. The amount of each transcript was quantitated and represented as described in (D).

