
FIGURE 5.
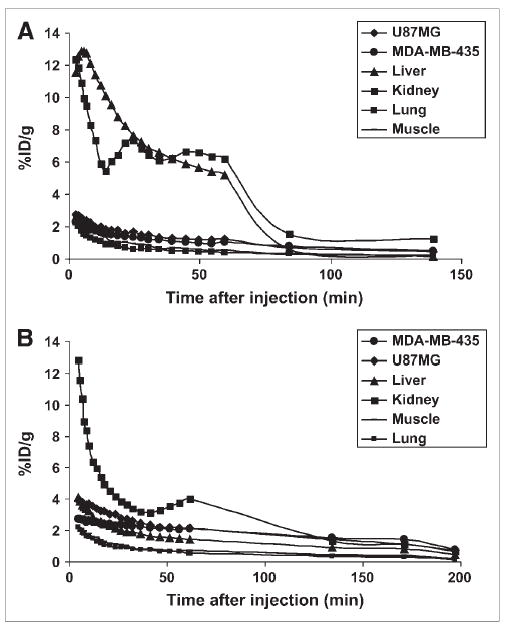
Time–activity curves of 18F-FBEM-SRGD (A) and 18F-FBEM-SRGD2 (B) obtained from microPET scans. The inflection point for tracer clearance is most likely due to the slower metabolism during the dynamic scan when mice were under anesthesia and body temperature was lowered.