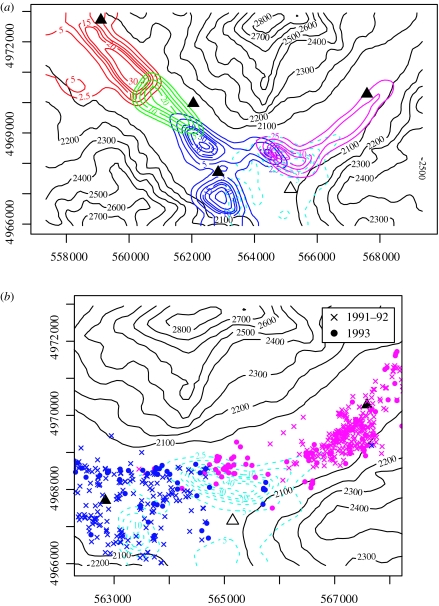
Figure 3.
(a) Coloured contour lines show the spatial distribution of home ranges in Lamar Valley predicted by the PA+CA model following loss of the centrally located Norris pack in January 1993. Solid contour lines show the new configuration of home ranges in relation to the former home range of the Norris pack indicated by the dashed light-blue contour lines. Patterns of space-use of the prior to the removal are shown in figure 2b. Black contour lines show topographic relief in metres. The location of the former home range centre of the Norris pack (open triangle) and the locations of the home range centres of the remaining packs (filled triangles) are also shown. (b) Observed changes in space-use by the Soda Butte and Fossil Forest packs following the loss of the Norris pack in January 1993. As in (a), the dashed light-blue contour lines show the former home range of the Norris pack. Coloured points show the relocations of individuals in the neighbouring Soda Butte (pink) and Fossil Forest (blue) packs prior to (crosses) and following (filled circles) the loss of the Norris pack. As predicted by the model (a), the Soda Butte and Fossil Forest packs expand their territories into the former Norris home range following the loss of the Norris pack focusing their movements on the prey-rich mesic grassland north of the former Norris home range centre (open triangle).

