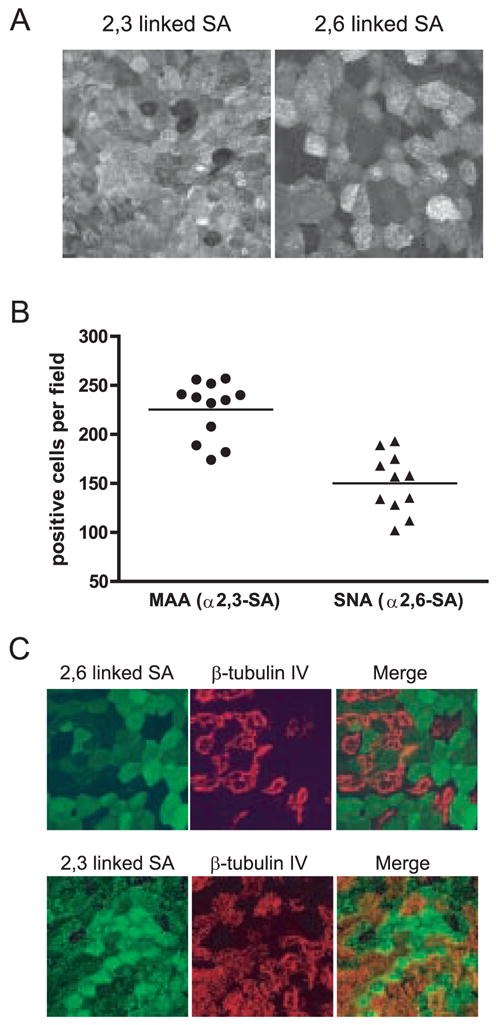
Figure 3.

The α2,3- and α2,6-linked forms of SA are expressed in hamster TEC cultures. (A) Representative image showing the distribution of α2,3- or α2,6-SA. (B) Quantitation of the number of cells per field expressing α2,3- or α2,6-SA. Each point represents an individual field. (C) The expression of α2,3- or α2,6-SA (green) compared to the ciliated cell marker β-tubulin IV (red). There is a low level α2,3-SA expressed in ciliated cells as compared to nonciliated cells (white asterisks indicate nonciliated cells expressing high amounts of α2,3-SA) but α2,6-SA appears to be expressed exclusively in nonciliated cells. All images were taken at a 63X magnification.
