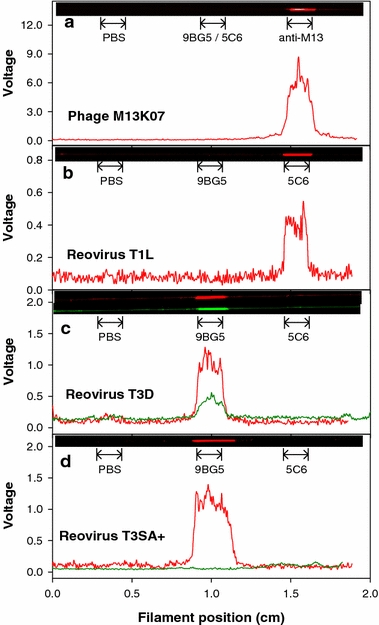
Figure 4.

Fluorescence intensity in volts as a function of filament position for M13K07 phage (A) and reoviruses T1L (B), T3D (C), and T3SA+ (D). The immobilized capture antibody positions on the filament are labeled within each panel. Captured virus was detected by a fluorescently labeled second antibody (anti-M13K07 [red], 8H6 [red], or 4F2 [green]). Corresponding images of the scanned filaments are shown at the top of each graph. Each panel shows a representative experiment of three performed.
