
Fig. 5.
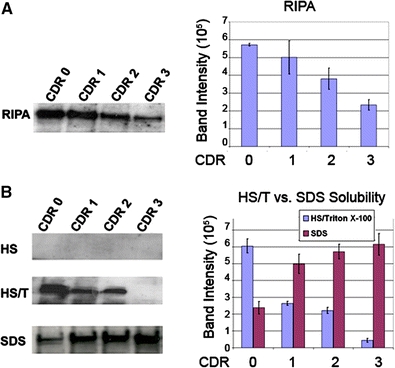
Western Blot analysis of dysferlin in nondemented and AD brains. a Nondemented (CDR 0) and AD brains (mild = CDR 1, moderate = CDR 2, and severe = CDR 3) were extracted in RIPA as described in the Materials and methods. Five microliters of each extraction were loaded into separate lanes of a 12% SDS-polyacrylamide gel electrophoresis and after transfer to nitrocellulose membranes were probed with antibodies against dysferlin. The blot demonstrates the presence of dysferlin in both normal and AD brains with declining levels of protein across disease progression. Band intensities were quantified and compared in a bar graph. There is a linear decrease in total dysferlin associated with disease progression (r = 0.998, P = 0.001). b The same brains were sequentially extracted with HS, HS/T, SDS and FA as described in the Materials and methods section as loaded onto 12% SDS-polyacrylamide gel electrophoresis as described earlier. Dysferlin was not seen in either the HS or FA fractions. Dysferlin was demonstrated prominently in HS/T fraction in the CDR 0 brains, with a significant reduction (F = 2,991, P < 0.001) of dysferlin in the HS/T fraction in the demented cases (CDR1 and 2) and was nearly undetectable in severe AD (CDR 3) In contrast, the SDS fraction representing insoluble phases of dysferlin demonstrated significant increases (F = 3138, P < 0.001) in the 230–272 kDa bands as dementia progressed from mild (CDR 1) to severe (CDR 3)