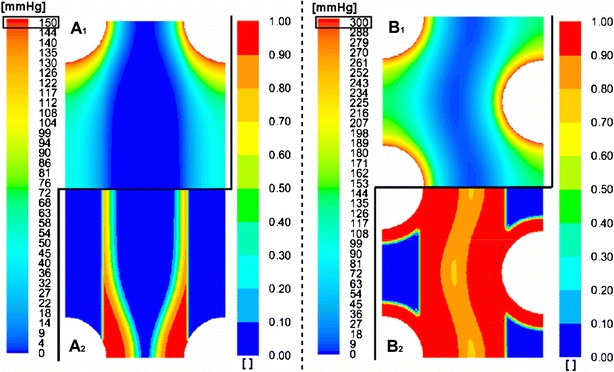
Figure 5.

Colorimetric contour plot of pO2 (mmHg, left legend, upper part 1) and effective hepatocyte utilization ratio Vratio (dimensionless, right legend, lower part 2) in a transverse plane midway through the first mat segment, in the reference case (case 1) of an inline micro model with hepatocyte distribution 1 (A1 and A2 resp.) and in a triangular micro model with hepatocyte distribution 2 and with double number of capillaries and doubled culture gas pO2 (case 11) (B1 and B2 resp.) (Note: B1 different scale compared to A1).
