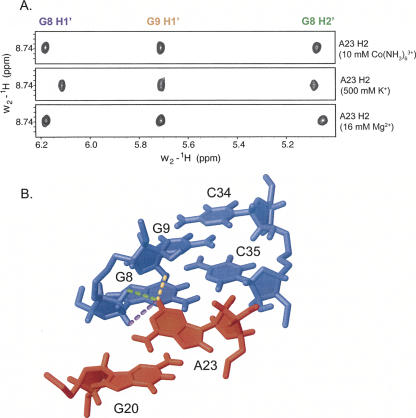
FIGURE 4.
Representative intermolecular NOEs observed upon GAAA tetraloop–receptor complex formation. (A) Strips from 2D NOESY spectra showing intermolecular NOEs from the tetraloop to the receptor in presence of 10 mM Co(NH3)6 3+, 500 mM K+, and 16 mM Mg2+. (B) Portion of the tetraloop–receptor complex (PDB ID 2ADT) with the tetraloop shown in red and receptor in blue. Dashed lines represent intermolecular NOEs shown in (A) from A23H2 to: G8H1′ (violet), G9H1′ (orange), and G8H2′ (green).

