Fig. 2.
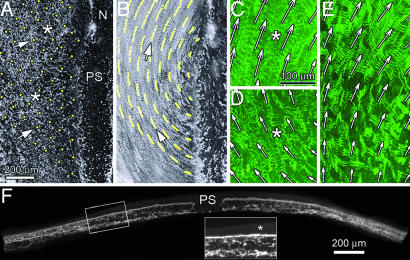
A PIV-determined tissue position-fate map for one side of a stage 5 embryo. (A) The embryo is “seeded” with virtual material particles (yellow dots). (B) Shown here are the trajectories of the particles over the first 10 time points (≈50 min). The arrows in A denote two specific particles and their trajectories (B). (C and D) Magnified regions of the embryo that have been projected over three time points to indicate the bulk motion. (E) A region of the same embryo near Hensen's node at a later time (5 h). Overlaid arrows represent the (normalized) displacement field, and the spacing of arrows (64 pixels) corresponds to the width of a refined subwindow. Note especially the bulk movement of extended fibrils, which in some cases exceeds 100 μm. Scale bars for C–E are the same. SI Movie 1 shows the full time-lapse sequence. (F) A transverse cross-section of an embryo labeled with microinjected FN label. The presence of label is detected throughout the thickness of the mesoderm tissue. The PS and ectodermal layer (asterisk in Inset) show only faint levels of background fluorescence. Scale bar in F is for the main image.

