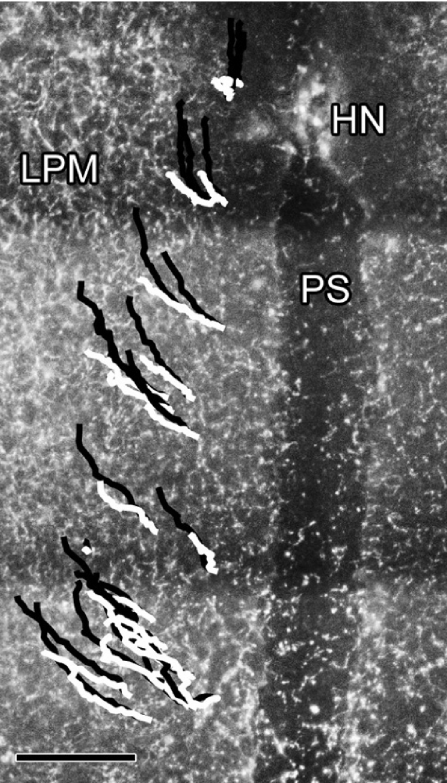
Fig. 3.
Shown are total (black) and cell-autonomous (white) cell trajectories over a 2-h time period on one side of an embryo. The trajectories are overlaid on an immunofluorescent FN image frame captured at t = 0. HN, Hensen's node; LPM, lateral plate mesoderm; PS, primitive streak. (Scale bar, 150 μm.) SI Movies 3 and 4 are high-resolution time-lapse sequences showing cells (green) migrating on the background of FN label (red).

