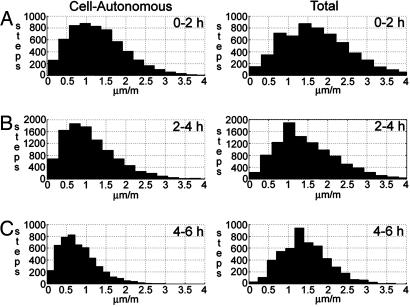
Fig. 4.
Distributions for cell-autonomous (Left) and total (Right) cell speed, after leaving the PS, for each of three time periods (0–2 h in A, 2–4 h in B, and 4–6 h in C). A step (data point) represents the movement of a single cell between two consecutive frames of a time-lapse sequence. Note that speed, the magnitude of the velocity vector, is always a positive measurement.

