
Fig. 2.
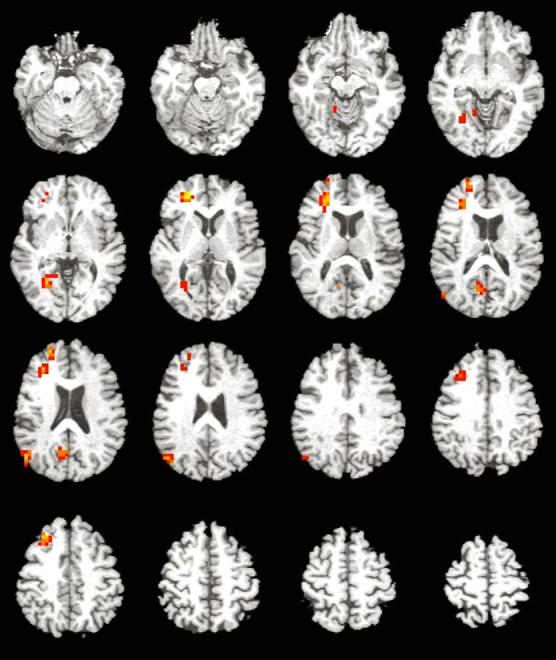
Magnitude and direction of voxel-level activation to the task superimposed onto axial slices of a representative image in Taliarach space (slices span from 19 inferior to 56 superior in 4 mm increments). Activation displayed includes voxels significant at p < 0.025 that are contained within a cluster of 15 or more voxels. Color scale represents effect sizes for the between-subject difference between OLD items and FIXATION as measured by η2 (red voxels: 40 < η2 < 60; orange voxels: 60 < η2 < 80; yellow voxels: 80 < η2 < 100 [η2 indexes the effect size for the magnitude of the difference between the observed response and 0]). See also Table 2 for areas of significant activation. Images are presented in radiological view.