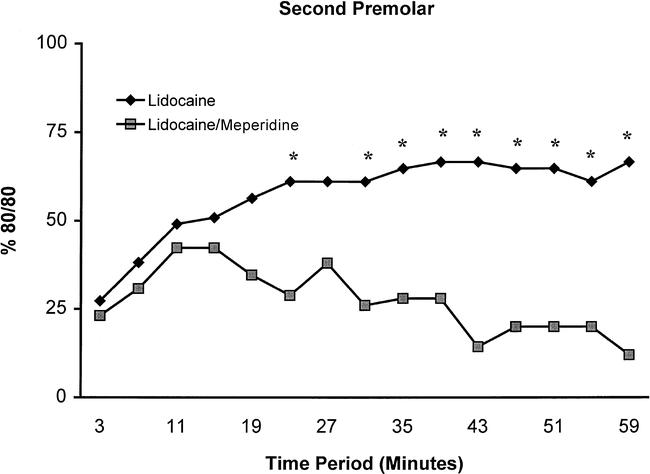
Figure 4.

Incidence of second premolar anesthesia as determined by lack of response to electrical pulp testing at the maximum setting (percentage of 80/80s) at each postinjection time interval for the lidocaine and lidocaine/meperidine solutions. Significant differences (P < .05) between the 2 anesthetic solutions are marked with an asterisk (*).
