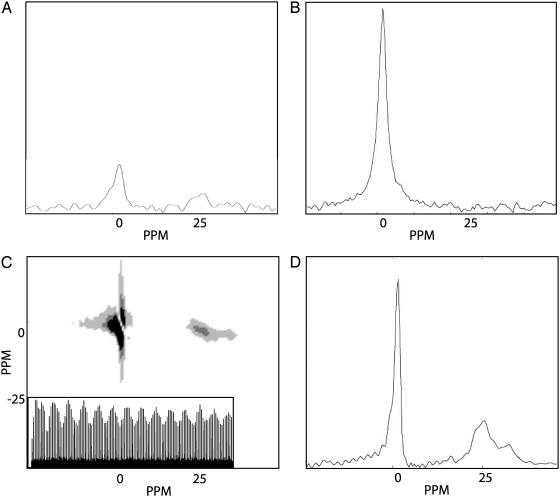
Fig. 5.
(A) Directly detected spectrum of 129Xe in the encoding coil obtained with one π/2 pulse and one signal acquisition. (B) Directly detected spectrum of 129Xe in the detection coil obtained with one π/2 pulse and one signal acquisition. (C) 2D time domain free induction decay (FID) data of the 2D remote experiment. Both the direct and indirect dimensions were obtained by measuring 128 points with a dwell time of 50 μs. No signal averaging was necessary for the acquisition. The indirect dimension contains point-by-point detected FIDs, which are encoded in the encoding coil, and after signal transfer, remotely detected in the detection coil. (Inset) One slice of the indirect spectrum FID. The unencoded 129Xe adds an apparent baseline offset to the indirectly detected FID, which is removed during processing. (D) The remote detection spectrum is one slice taken at the maximum gas peak of the direct dimension along the indirect dimension of the 2D data in C. The spectrum reconstructs the spectral information in the encoding coil although it is measured in the detection coil. Comparison of A and D shows that the remote detection experiment shows an SNR improvement of a factor of ≈10 times, consistent with the SNR difference between the direct spectra in A and B taken in the encoding and detection coils, respectively.

