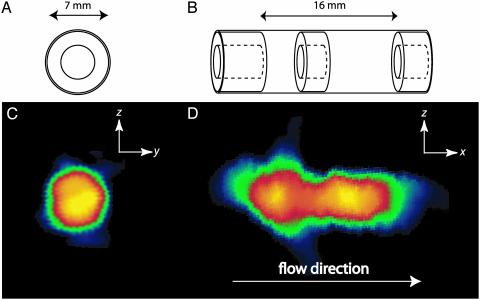
Fig. 6.
The sample cell in the encoding site is a cylindrical glass (7 mm i.d.) tube with a concentric annular restriction (doughnut-shaped Teflon spacers) in the middle and at both ends. (A and B) The sample schemes. (C and D) The corresponding 2D remote detection images encoded at low field and detected at high field. The schematic diagrams show the dimensions of the glass sample tube (A) and location of the restrictions (B) and also indicate the directions of the projection used for each image. For both images, tt was set to 7 s, corresponding to a flow rate of 6 ml/s and a traveling distance of ≈5 m. Eighteen repeated detection pulses, separated by 0.15 s, are sequentially acquired to detect the entire encoded signal volume. The images are encoded by using the technique of filtered back projection, which involves physically rotating the probe on a polar raster relative to the gradient coils (28). (C)A yz projection reconstruction image of the void space of the sample tube encoded at 4 mT. Eight projections separated by 22.5° (128 points are acquired for each projection) are used for the reconstruction of the 2D image. Each projection is measured by using a gradient strength of 1.23 mT/m, where the gradient was oriented along a proscribed angle, yielding a nominal resolution of 1.2 mm in the 1D projection. (D)An xz image encoded at 7 mT. The image was reconstructed from sixteen 1D projection (64 points for each projection). The same gradient strength as in C is used here. For data processing of both 2D images, the k-space data were zero-filled to 256 points before Fourier transformation. Each 2D image was acquired with a total of 1,024 points, each of which took about 12 s to acquire, for a total acquisition time of3h40 min. Considering, however, that2hofthe total acquisition time was used for travel time and that 18 separate acquisitions were averaged (rather than taken as 18 separate images), it is clear that the total experimental time can be greatly reduced.

