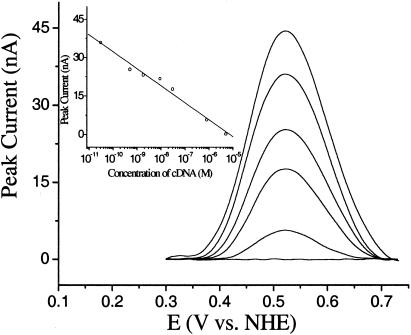
Fig. 2.
Background-subtracted (35, 37) voltammograms (anodic scan) for the E-DNA sensor in the presence of complementary DNA at 0 M, 30 pM, 500 pM, 30 nM, 800 nM, and 5 μM (from top to bottom). The hybridization time was fixed at 30 min. (Inset) A calibration curve demonstrating peak height versus target concentration; E-DNA sensor response is logarithmically related to target concentration over at least six orders of magnitude.

