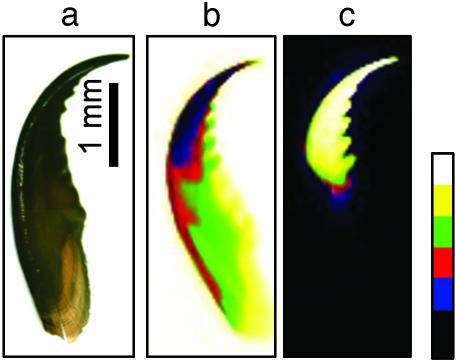
Fig. 1.
Zn distribution in Nereis jaw. (a) Whole jaw under the light microscope. The tip is considerably darker than the base. (b) X-ray absorption image of jaw. The tip region appears darker than the rest of the jaw, indicating higher absorption. (c)AZnK α fluorescence image shows Zn concentrated in the tip of the jaw.

