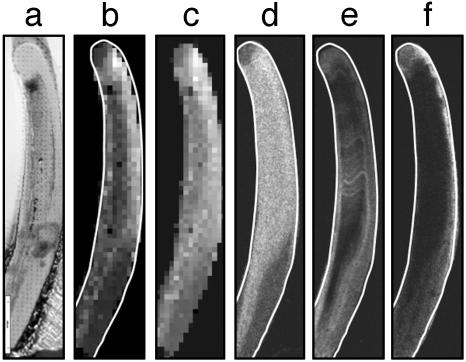
Fig. 5.
Combined study of local mechanical properties and element concentration on a Nereis jaw tip. (a) Light microscopy image of a longitudinal section of a Nereis jaw after nanoindentation. One can see the two-dimensional array of indents that cover the sample. (b) Hardness map of the sample obtained by arranging the hardness values measured for each indent into a pseudo-grayscale image. Each pixel corresponds to an actual measurement, and bright gray denotes higher hardness values. (c) Elastic modulus map obtained from nanoindentation. Bright gray denotes higher elastic modulus. (d) Element map showing the Zn distribution in the Nereis jaw tip as measured by electron microprobe analysis. Brighter regions indicate higher levels of Zn. (e) Br element map measured by microprobe analysis. The Br is mainly concentrated on the surface of the sample. There is no correlation with the Zn distribution. (f) Distribution of I in the Nereis jaw tip (element map by electron microprobe analysis). I is restricted to the surface of the jaw.

