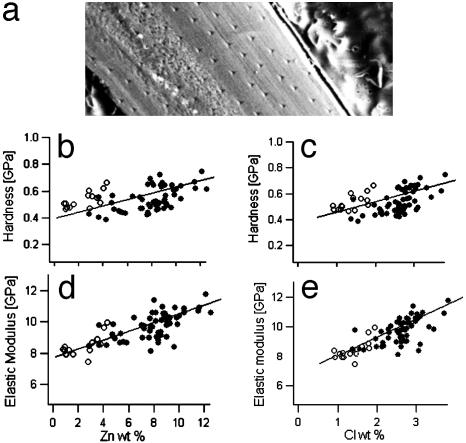
Fig. 8.
Quantitative correlation of mechanical properties and local element concentration. (a) Scanning electron microscopy image of part of the sample in the electron microprobe instrument. The indents from the nanoindentation experiment are clearly visible. Each of them was associated with specific coordinates that were used for orientation on the sample for the subsequent quantitative element analysis at selected points. (b and c) Hardness plotted versus Zn (b) and Cl (c) concentration. •, Data from the tip; ○, data from the middle of the jaw. There is a positive correlation between the concentration of Zn and Cl and the hardness. (d and e) Elastic modulus plotted versus Zn (d) and Cl (e) concentration. The stiffness increases with increasing levels of Zn and Cl. The lines in b–e are included as guides to the eye.

