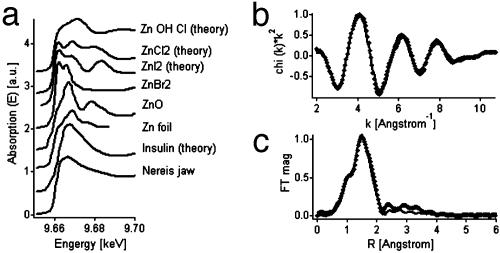
Fig. 9.
X-ray absorption analyses. (a) XANES of Nereis jaw and Zn-containing model compounds for comparison. The curve at the bottom, obtained from Nereis jaw, was found to be identical in different Zn-containing parts of the jaw. It is plotted together with spectra from simple model Zn compounds that were generated from experimental scans or calculated by using the software feff8. (b) EXAFS of Nereis jaw (filled symbols) in k-space. (c) Fourier transform of EXAFS data of Nereis jaw, depicted in R-space. The full line corresponds to a fit with a theoretical Zn insulin standard calculated by feff8.

