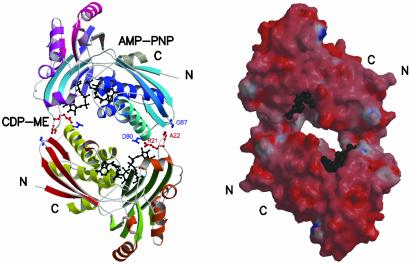
Fig. 2.
The CDP-ME kinase dimer. (Left) Ribbon diagram viewed parallel to the NCS 2-fold. The residues shown as red or blue balls and sticks (Arg-21, Ala-22, Asp-80, and Gly-87) contribute to dimer formation through electrostatic interactions. Substrate and cofactor are shown as black balls and sticks. (Right) Surface representation is colored blue for basic and red for acidic residues. Ligands are depicted as black spheres.

