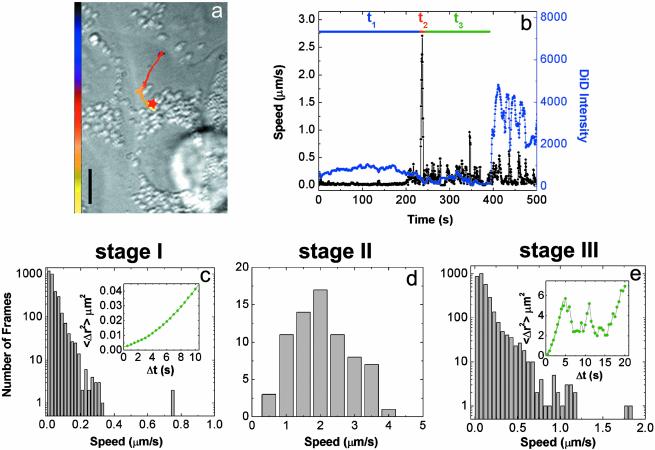
Fig. 2.
Tracking the transport and fusion of individual influenza viruses. (a) The trajectory of a DiD-labeled virus inside a cell. The color of the trajectory codes time with the colored bar indicating a uniform time axis from 0 s (black) to 500 s (yellow). The red star indicates the fusion site. (Scale bar: 10 μm.) (b) Time trajectories of the velocity (black) and the DiD fluorescence intensity (blue) of the virus. t1, t2, and t3 are the durations of stages I, II, and III, respectively. Stage II movements can be consistently identified for each viral trajectories as the rapid unidirectional translocation from the cell periphery to the perinuclear region. Stage I is then defined as the period before this transient motion, and stage III is defined as the period after stage II but before fusion. (c) Histogram of the viral velocity in stage I. (Inset) Shown is the measured average mean square displacement (〈Δr2〉) vs. time (Δt) for a virus (green symbols). The green line is a fit to 〈Δr2〉 = constant + DΔt + (vΔt)2 with D = 0.001 μm2/s and v = 0.02 μm/s. The small constant term is due to noise. About 60% of the viral trajectories in stage I show such superlinear dependence of 〈Δr2〉 on Δt. Because of the diffusion-like component of the movement (DΔt), the instantaneous speed in the histogram (=Δr/Δt) depends on Δt, which is chosen to be 0.5 s in c–e. (d) Histogram of the viral velocity in stage II. (e) Histogram of the viral velocity in stage III. (Inset) Shown is a typical example of 〈Δr2〉 vs. Δt. To represent the bursts of relatively fast movements in stage III, the 〈Δr2〉 vs. Δt plot was calculated by using only those points where the virus is traveling with speed >0.3 μm/s. The green line is a fit of the first eight data points to 〈Δr2〉 = constant + D′Δt + (v′Δt)2 with D′ = 0.5 μm2/s and v′ = 0.4 μm/s. The small constant term is due to noise.

