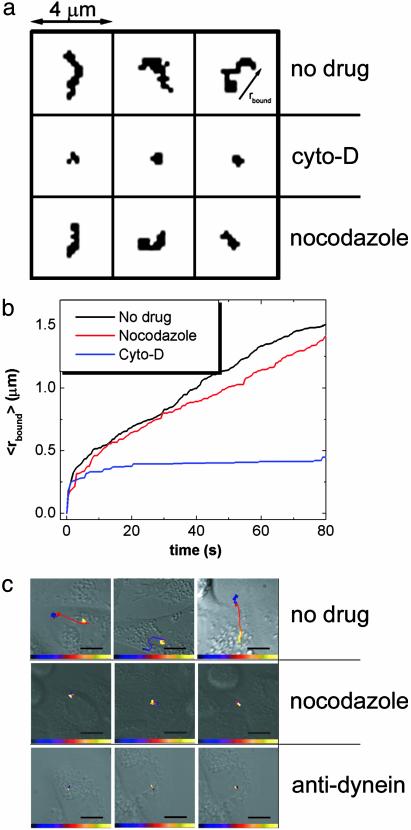
Fig. 3.
Effects of drugs and antibodies on viral transport properties. (a) Viral trajectories of the first 100 s of viral movement in untreated, cyto-D-treated, and nocodazole-treated cells. The arrow in Upper Right indicates the minimum radius (rbound) of a circle centered at the origin of the trajectory that can cover the entire trajectory at a given time. (b) The average rbound over many trajectories as a function of time. The rbound in untreated and nocodazole-treated cells quickly exceeds the rbound attained in cyto-D-treated cells. The rapid, initial increase of rbound in the cyto-D-treated curve likely arises from restricted diffusion of the viruses or undulations of the cells, and does not occur for viruses immobolized on glass. (c) Viral trajectories (10–15 min) in untreated cells, nocodazole-treated cells, and cells injected with anti-dynein (1 mg/ml). The time-color scale is similar to that described in Fig. 2. (Scale bar: 10 μm.)

