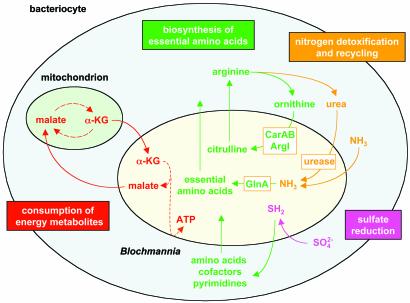
Fig. 2.
Relevant metabolic interactions between Bl. floridanus and its host cell, as deduced from its genome sequence. For clarity, the metabolic pathways shown are simplified. α-KG, α-ketoglutarate; ArgI, ornithine carbamoyltransferase chain I; CarAB, carbamoyl-phosphate synthetase; GlnA, glutamine synthetase.

