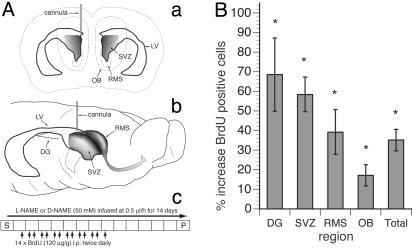
Fig. 2.
(A) Scheme of l-NAME or d-NAME infusion and BrdUrd administration. (a and b) Projection diagrams of the relationship of the infusion point into the LV of the rat brain showing anatomy including the SVZ, RMS, LV, OB, and DG. (c) The protocol for administration of BrdUrd and l- or d-NAME in relation to the time for surgery (S), infusion of drugs, and perfusion (P). (B) Changes in the numbers of BrdUrd+ nuclei after persistent NOS inhibition. Absolute counts of BrdUrd+ nuclei of different regions from serially sampled sagittal sections of l-NAME-infused animals show increases in all areas examined when compared with d-NAME-treated animals. The “total” column represents the sum of all the regions examined. The Mann–Whitney test shows that the differences in all tested regions were significant (P < 0.05; see Table 1). DG here refers to the S-GCL and GCL.

