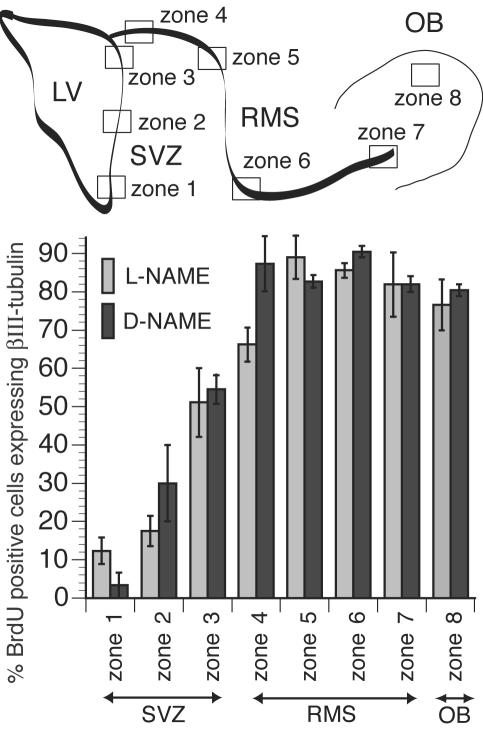
Fig. 3.
NOS inhibition does not change the fate of cells born in the SVZ and RMS and destined for the OB. A highly schematic diagram of neurogenic zones in adult rodent brains is shown (Upper) to identify the zones for the histogram (Lower). The percentage of cells that have incorporated BrdUrd and express the neuronal marker βIII-tubulin was compared in several arbitrarily defined zones along the SVZ, RMS, and OB for l-NAME-treated and control (d-NAME-treated) animals. Scoring was performed by using confocal z series of images through the sections with orthogonal projections as shown for the data in Fig. 4. There was no statistically significant difference between these treatments for each zone tested, suggesting that the choice of neuronal fate by the majority of new cells in these regions was not affected despite the numbers of new cells being significantly increased in l-NAME-treated animals (Fig. 2B). Mann–Whitney test: P = 0.121, 0.154, 0.827, 0.077, 0.275, 0.105, 0.653, and 0.513 for zones 1–8, respectively.

