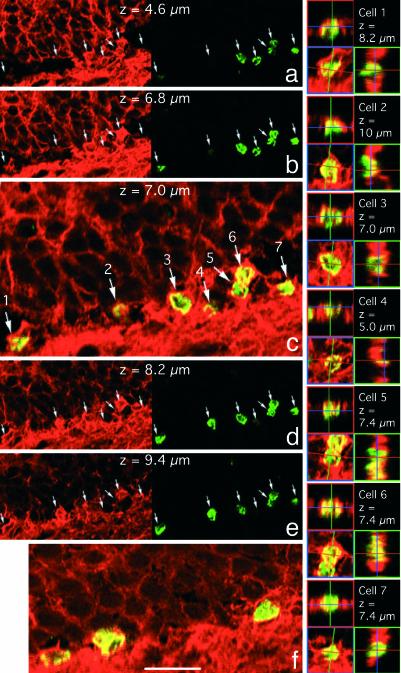
Fig. 4.
New cells in the DG choose neuronal fate. (a–e) Confocal microscope optical sections at 1.2-μm intervals from the DG of an animal exposed to l-NAME. (f) Representative section from the DG of the control d-NAME-treated animal. a, b, d, and e show the βIII-tubulin (red, Left) and BrdUrd (green, Right) staining; c and f show merged channels. Note that the scale on c is twice the scale on a, b, d, and e. Each cell in c is identified with a number, and the orthogonal projection for this cell is presented on the right. In this field of view of seven cells in the DG S-GCL, only cell number 4 does not meet our criteria for coimmunostaining for both BrdUrd and βIII-tubulin as described in Supporting Materials and Methods. The numbers of BrdUrd+ cells expressing βIII-tubulin are quantitated in Fig. 5c. (Scale bars: c, f, and the orthogonal projections, 20 μm; a, b, d, and e, 40 μm.)

