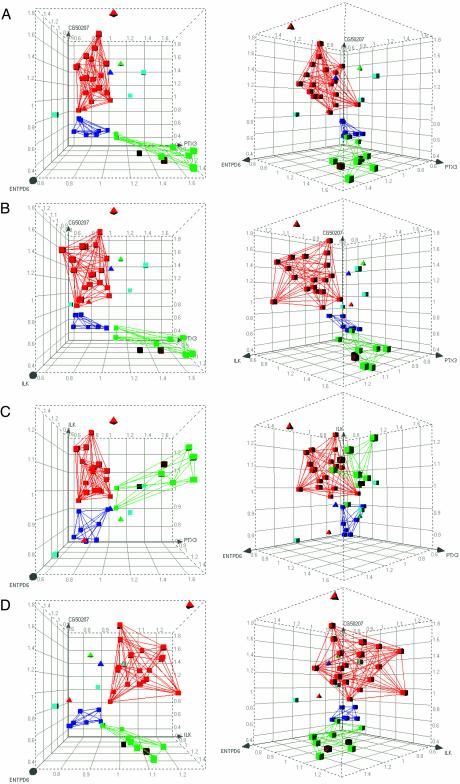
Fig. 1.
Three-dimensional representation of class discrimination on the basis of biomarker expression: classification tree. All possible three-way combinations of the four-gene marker set from CT iteration-one are displayed: (CG50207 vs. ENTPD6 vs. PTX3) (A), (CG50207 vs. ILK vs. PTX3) (B), (ILK vs. ENTPD6 vs. PTX3) (C), and (CG50207 vs. ENTPD6 vs. ILK) (D). Axes represent relative expression levels of marker genes, with means set to 1.0. Each graph is shown perpendicular to the XY plane (Left), and from 45° rotation around the y axis (Right). Red, antidepressant; dark blue, antipsychotic; green, opioid; brown, PCP; black, amphetamine; light blue, vehicle control; squares, correctly predicted treatments; triangles, misclassified treatments. Lines connecting correctly predicted treatments delineate the volume occupied by each accurately defined sample class. Note distinct class separation and placement of untreated control samples outside the treatment classes.

