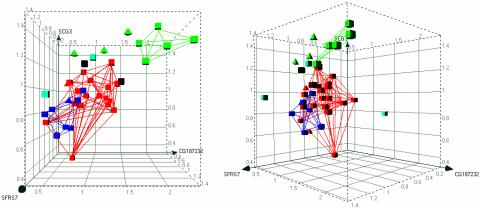
Fig. 2.
Three-dimensional representation of class discrimination on the basis of biomarker expression: random forest. The three biomarkers with importance measures >0.75 are depicted: (SFRS7 vs. SCG3 vs. CG187232–01). Axes represent relative expression levels of marker genes, with means set to 1.0. The graph is shown perpendicular to the XY plane (Left), and from 45° rotation around the y axis (Right). Red, antidepressant; dark blue, antipsychotic; green, opioid; brown, PCP; black, amphetamine; light blue, vehicle control; squares, correctly predicted treatments; triangles, misclassified treatments.

