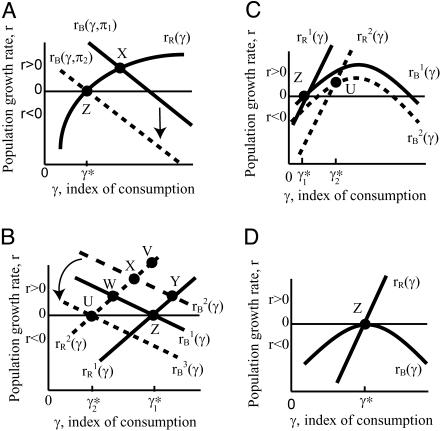
Fig. 1.
(A) Equilibrium population size and age distribution, reflecting density and intergenerational transfers (see Population Equilibrium with Intergenerational Transfers for details). (B) The effect on r and γ of a mortality-reducing mutation when the balance curve is downward sloping (see Mutation and Selection Without Age). (C) Selection effects on the left of a hump, where the classical effects are reversed. Evolution moves toward the optimal equilibrium at the peak (see The Evolutionary Trajectory to the Optimal Equilibrium). (D) The optimal equilibrium is evolutionarily stable (see The Evolutionary Trajectory to the Optimal Equilibrium).

