
Fig. 5.
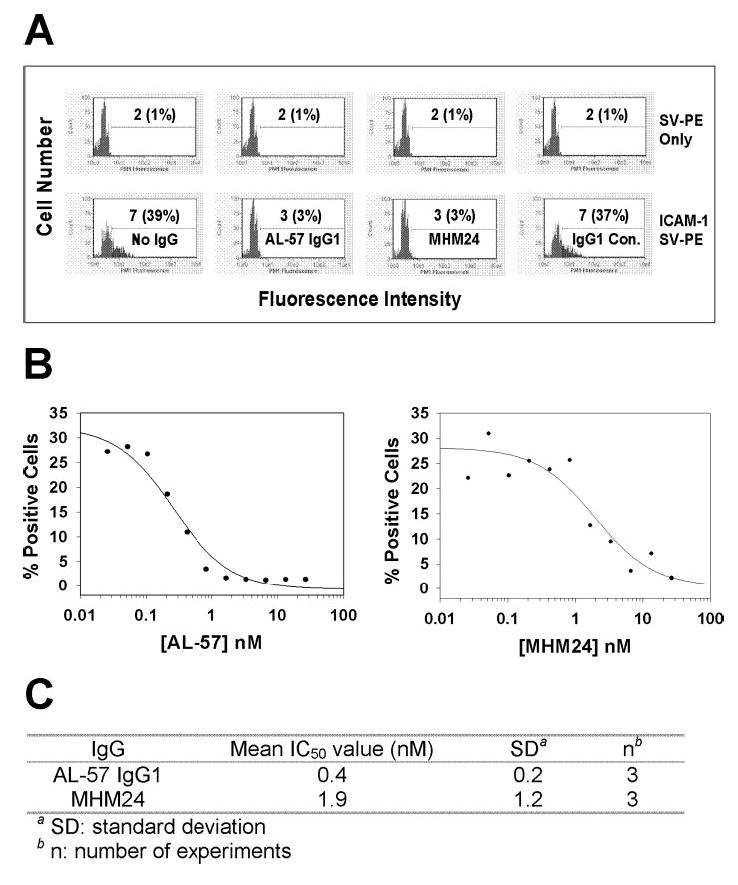
AL-57 IgG1 inhibits ICAM-1 binding to HA cells. ICAM-1 binding in the presence or absence of each IgG was measured by staining HA cells with a soluble, multimeric ICAM-1 complex with ICAM-1-Fc concentration at 2 μg/ml and flow cytometric analysis. (A) Representative histograms of samples in the absence or presence of AL-57 IgG1, MHM24, or hIgG1 control at 4 μg/ml (26.8 nM). The x-axis depicts the fluorescence intensity of individual cells, and the y-axis represents the cell number. SV-PE only indicates negative control with PE-labeled streptavidin alone for staining. The numbers shown are relative values of MFI with relative percentages of positive cells in parenthesis. (B) IC50 determination of AL-57 IgG1 and MHM24. The percentage of positive cells from each sample was plotted as a function of the IgG concentration. From the representative plots shown here, IC50 values were calculated to be 0.3 nM for AL-57 IgG1 and 2 nM for MHM24 using SigmaPlot 8.0 software. (C) Summary of IC50 values from three independent experiments.