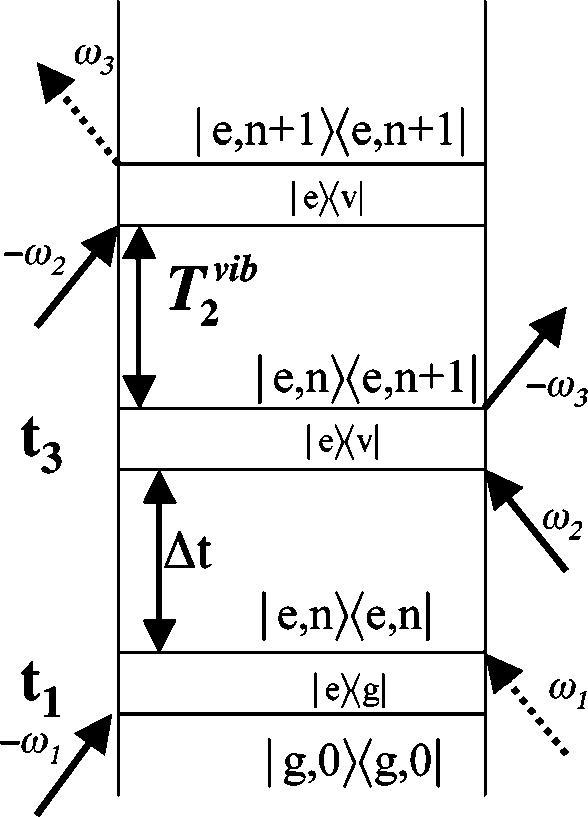
FIG. 2.

Feynman diagram describing the evolution of the density matrix for FSRS. The time delay, Δt, between the actinic pump (ω1) and probe (ω3) beams determines the delay between the electronic excitation of the sample and the initiation of the Raman transition. The vibrational dephasing time determines the linewidth of the Raman peaks. Use of a picosecond duration Raman pump (ω2) allows the Raman spectrum to sample the full T2 time of the vibrational transition and thereby produces lineshapes determined by the intrinsic molecular limits.
