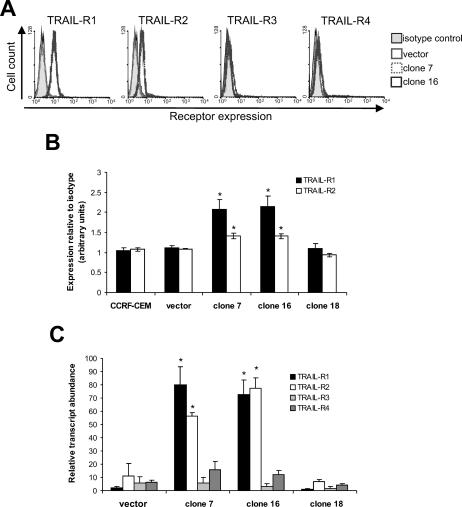
Fig 3.
TRAIL-R1 and TRAIL-R2 are up-regulated in CCRF-CEM cells expressing Hsp70. (A) Expression of TRAIL receptors on the plasma membrane was analyzed by flow cytometry. (B) For quantitation, results were expressed as the ratio of the geometric mean of receptor expression to the geometric mean of the corresponding isotype control. The means and standard deviations of 3 independent experiments are shown. (C) Expression of receptor mRNA was assessed by SYBR Green RTQPCR using specific primers. The means and standard deviations from 3 independent RNA extractions are shown. Statistical analysis by Student's t-test; *P < 0.05 compared to vector control

