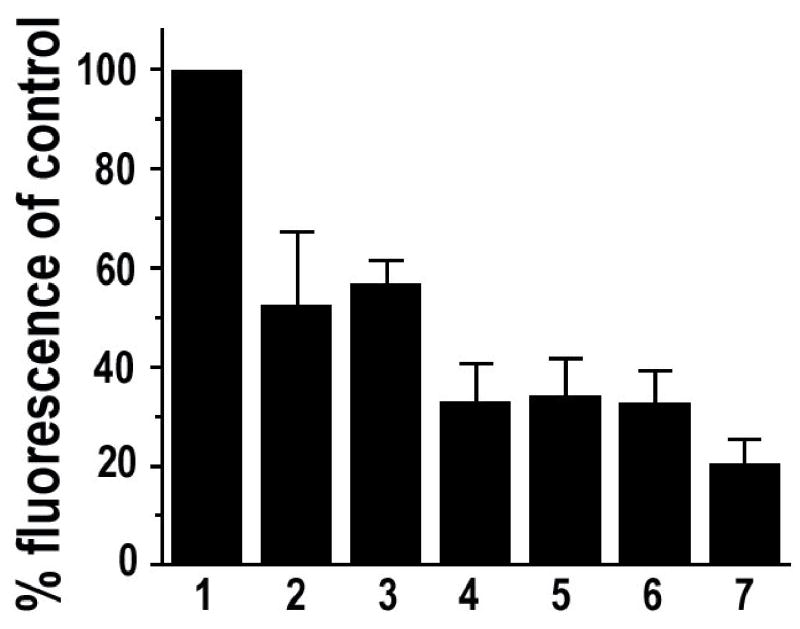
Fig. 2. Quantitative results of exogenous HRP inhibition.

Each column represents normalized data for samples treated with: 1 PBS; 2 0.05 mM of phenylhydrazine; 3 10 mM of glucose and 1 unit/ml of glucose oxidase; 4 1 mM of NaN3; 5 3% of H2O2; 6 1 mM of NaN3 combined with 3% of H2O2; 7 0.02 N of HCl. Compared to the PBS control, all the other treatments resulted in significant inhibition of the HRP (P< 0.01). Error bar = SEM. Data are from at least three independent experiments and represent measurements of 80–190 cells for each treatment group.
