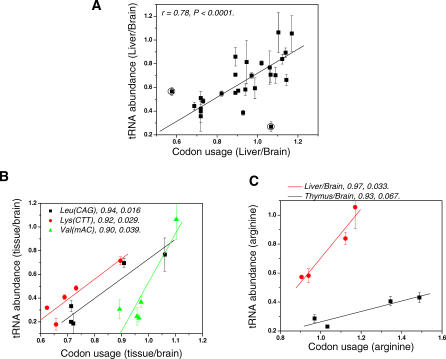
Figure 4. Linear Correlation of Relative tRNA Abundance to Codon Usage of Tissue-Specific Genes that Are Expressed at High Levels.
The r- and p-values are indicated in each graph.
(A) Liver/brain, all data points. Excluding the two outlying data points (circled) gives a linear fit with r = 0.78, p < 0.0001, and a slope of 1.0 ± 0.2. Inclusion of these two data points gives a linear fit with r = 0.62, p = 0.00098, and a slope of 0.8 ± 0.2.
(B) Three individual isoacceptors across all five tissues show linear correlation with r = 0.90 to 0.94 and p = 0.016 to 0.039.
(C) Two sets of four tRNAArg isoacceptors in liver and thymus show linear correlation with r = 0.93 and 0.97 and p = 0.067 and 0.033, respectively.

