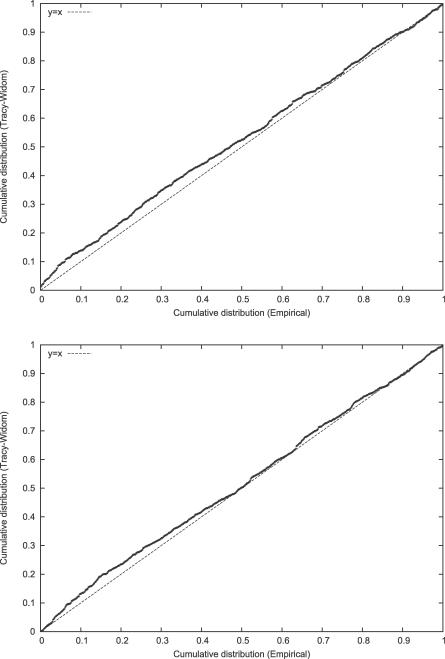
Figure 2. Testing the Fit of the TW Distribution.
(A) We carried out 1,000 simulations of a panmictic population, where we have a sample size of m = 100 and n = 5,000 unlinked markers. We give a P–P plot of the TW statistic against the theoretical distribution; this shows the empirical cumulative distribution against the theoretical cumulative distribution for a given quantile. If the fit is good, we expect the plot will lie along the line y = x. Interest is primarily at the top right, corresponding to low p-values.
(B) P–P plot corresponding to a sample size of m = 200 and n = 50,000 markers. The fit is again excellent, demonstrating the appropriateness of the Johnstone normalization.

